
Go to the Dashboard.
About the Dashboard
A fair transport system is one that enables all people to engage in a broad range of activities, regardless of their abilities (financial or otherwise). While seemingly obvious, few transport authorities around the world actually assess whether transport systems achieve this basic goal.
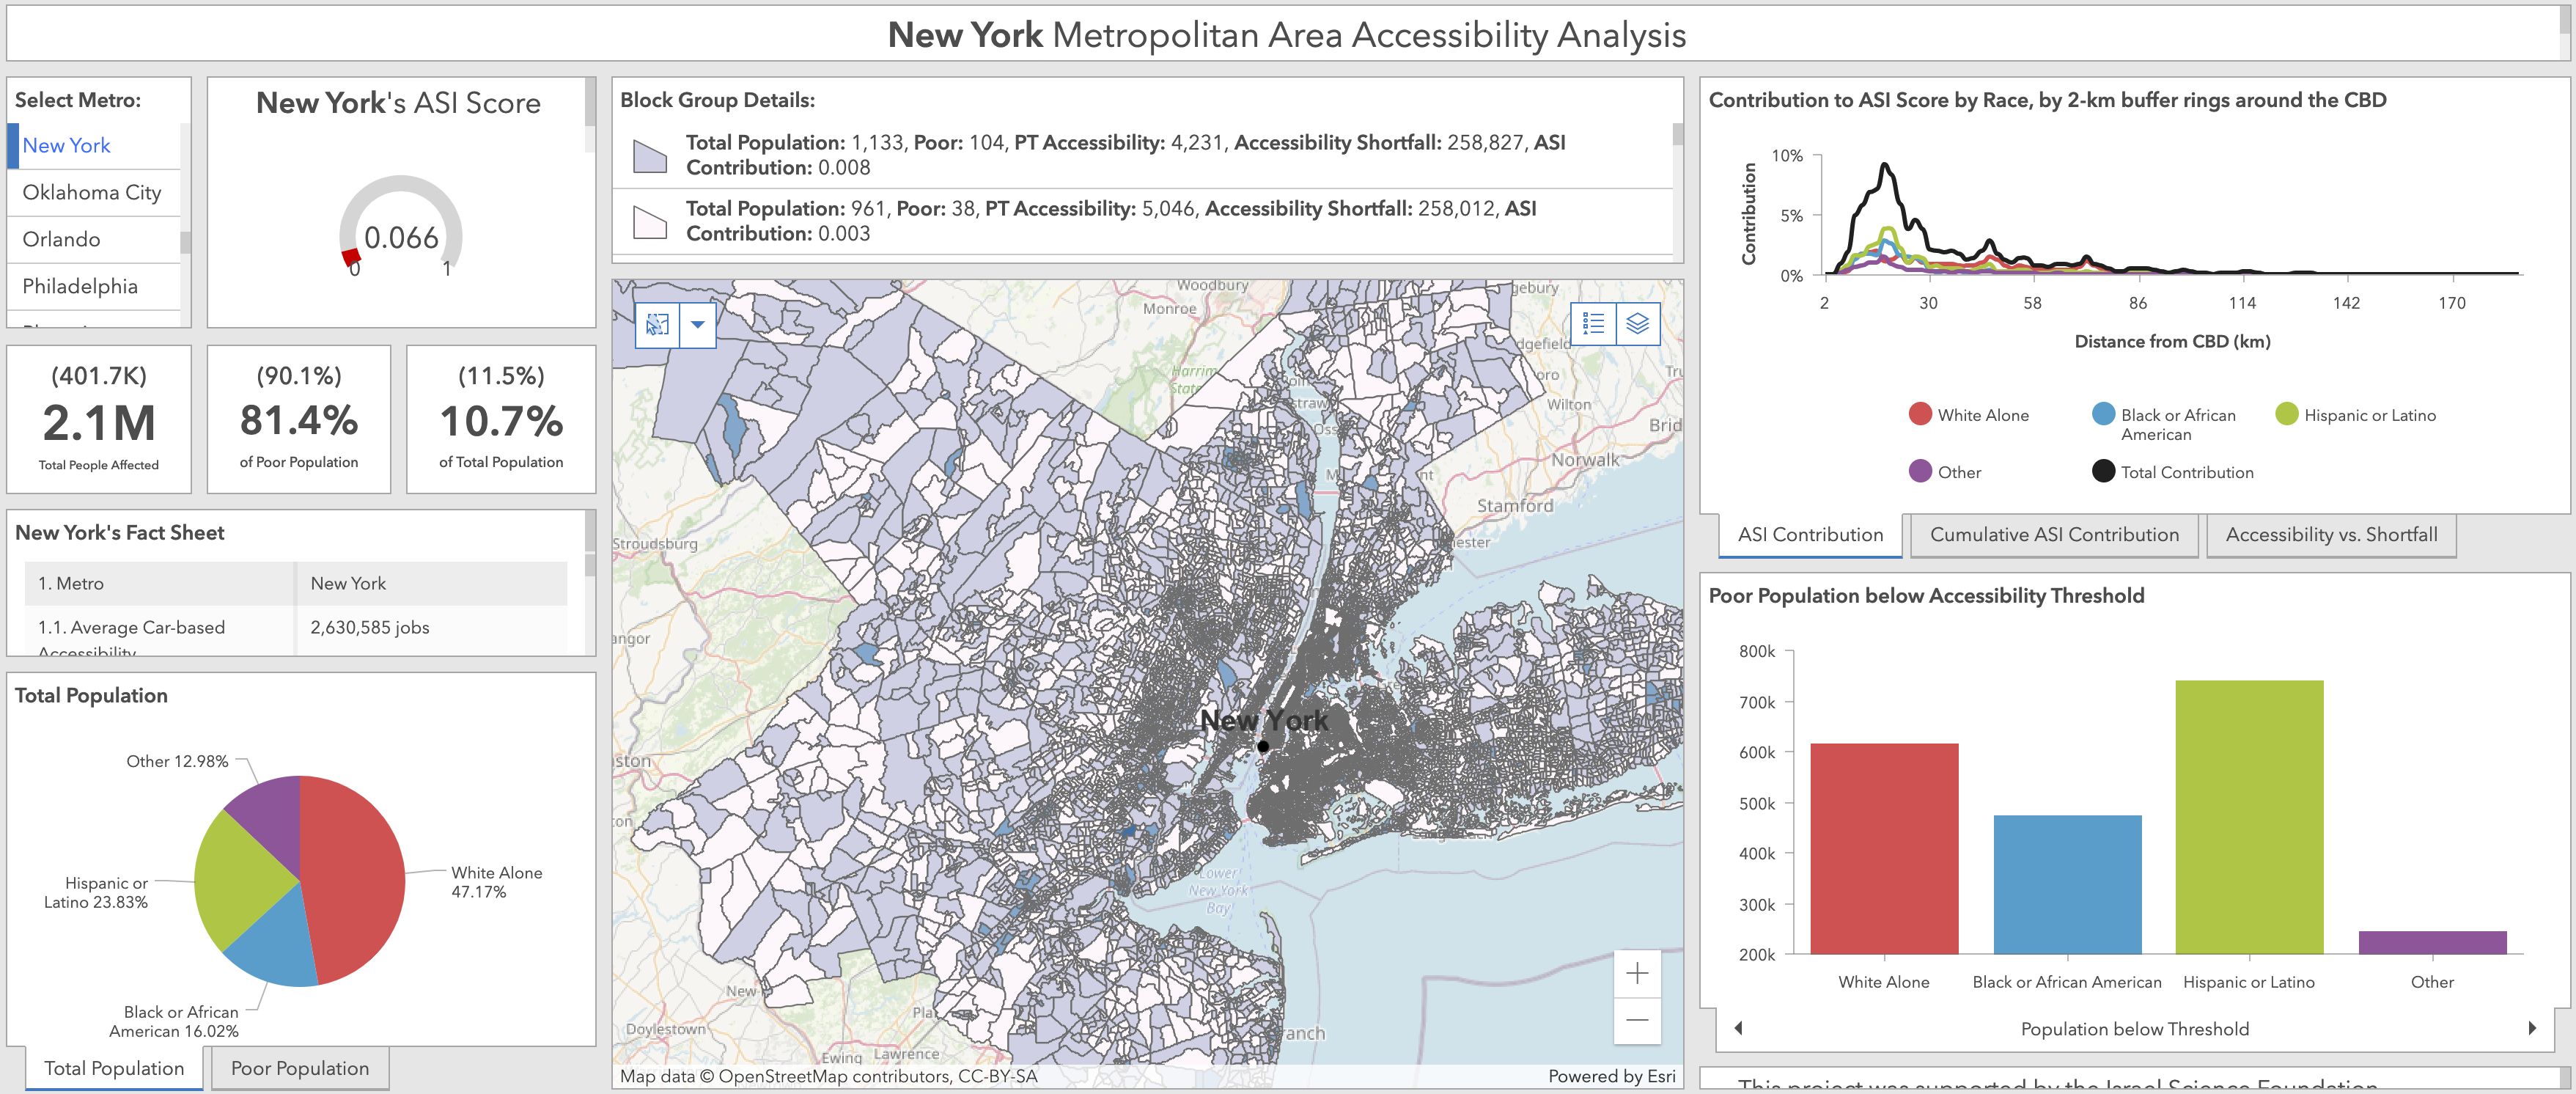
The Accessibility Sufficiency Dashboard tracks the state of transport systems in 49 large metropolitan areas in the USA. Employing an explicit sufficiency standard for accessibility, the dashboard identifies where transit does and does not provide sufficient access to key destinations. For each metropolitan area, the Dashboard identifies neighborhoods above and below the accessibility sufficiency threshold and accounts for the number of people (potentially) affected by insufficient accessibility. Featuring graphs, maps, and statistics, the Dashboard provides detailed insights into the (spatial) patterns of accessibility insufficiency in US regions.
Information on key terms and definitions as well as on how to use the Dashboard is available in the Dashboard Glossary.
The Dashboard aims to help decision makers, planners, advocates, and residents understand the state of the transport system in their region. They can use the Dashboard to examine the state of accessibility insufficiency in their metropolitan area, city, and neighborhood. Decision makers and advocates can use the evidence captured by the Dashboard (and Dashboard-inspired tools) in their efforts to improve the transport system in their jurisdiction.
Watch a presentation about the Dashboard.
Contact Us
We encourage you to contact us with any questions or feedback about the Accessibility Sufficiency Dashboard.
* This dashboard was built by Aviv-Lee Cohen-Zada, Matan Singer and Karel Martens within the framework of the ISF-funded project ‘Assessing and Explaining Equity in Accessibility for US Metropolitan Areas’ (Israel Science Foundation, grant number 1727-18). The accessibility data were generously shared by the Accessibility Observatory at the University of Minnesota.